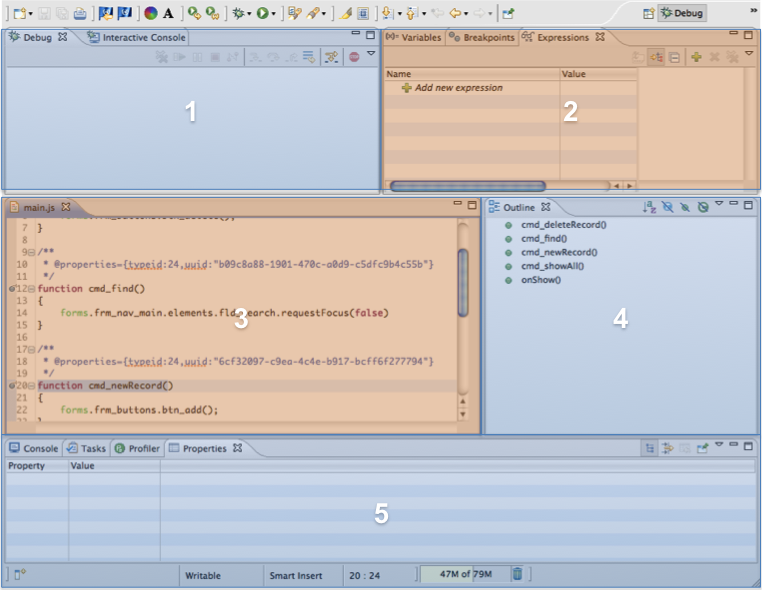
The Debug perspective contains the following views, divided into five main areas, described below from left to right and top to bottom.

Note: In Eclipse, you can also open the Command Console view to interact with the client. The command console links to the specific client being run and evaluates code on top level within solution (as opposed to the Interactive Console, which evaluates on a line-by-line level). When two clients are active, e.g. the Smart Client and Web Client, the command console allows you switch between active clients. |

Note: If a desired view is not visible in your Debug perspective, you can open it using the main menu item Window>Show View (Popular debug views are shown in this menu; clicking Other opens a browser that allows you to search all available views). |
Note: Many of these views have context-specific toolbars located at the top right of the view that allow easy access to commonly used functions within the view. Users can also access view options by clicking on the inverted triangle found at the top right corner of the view. |