Page History
When your Servoy is using a lot of memory, it might help Servoy R&D to provide a memory dump to find the origin of this memory use.A significantly more memory that expected, the memory usage can be analysed on the Java level.
While setting up the tools to make inspection of the memory used by Servoy is relatively straight forward, the actual analysis required detailed understanding of both Java and up to a point the Servoy codebase. As such, doing the actual analyses is not for everyone, but the tools described in this tutorial allow for making a dump of the entire memory usage to file, which can then be send to anyone with the skills to do the analysis, for example Servoy Support.
Setting up the tooling
Part of the Java Development Kit (JDK) comes with is a tool called VisualVM which VisualVM which shows all kinds of info about the Java Virtual Machine (JVM) and allows to dump the memory.
...
As VisualVM is
...
part of the JDK, it is not available in the Java Runtime Edition (JRE). If JDK is not installed, it must be installed first.
Make sure to have a JDK and thus VisualVM installed for the same architecture (32 vs. 64 bit)
...
as the Java process used that is to be inspected. When using a 32-bit VisualVM to inspect a 64-bit Java process, not all options of VisualVM will be available, like the option to make a memory dump
Running VisualVM
On Windows VisualVm can be found in JDKin \{JDK_INSTALL}\bin\jvisualvm.exe
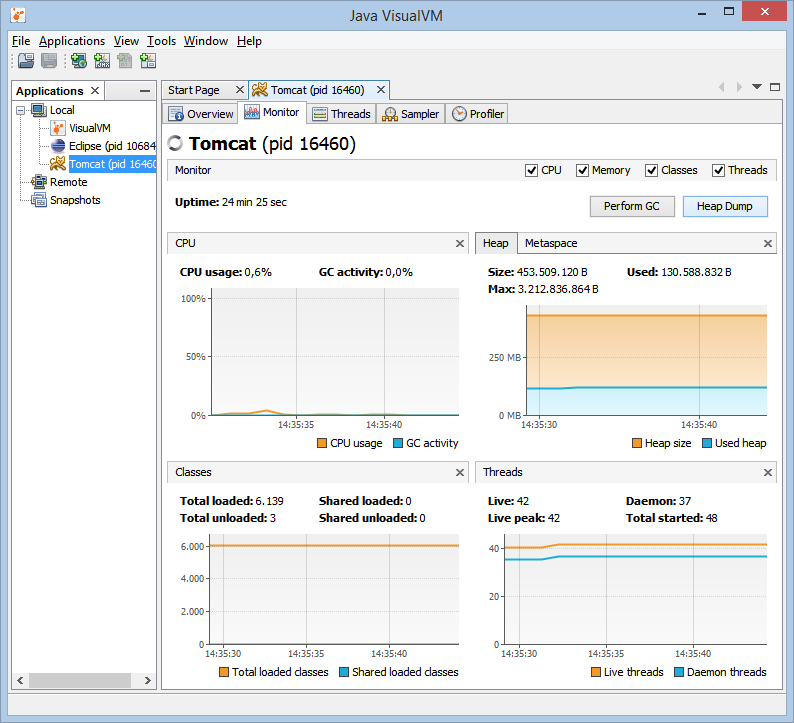
When launched (on windowsWindows) the GUI looks like:
Steps to get a memory dump:
...
Note that services can't be inspected, so it the process that needs to be inspected is a Servoy Application Server running as a service, the Java process of the Servoy Application Server cannot be inspected. In order to inspect that Servoy Application Server, the service must be stopped and then the Servoy Application Server must be started manually.
Making a dump of the memory
The steps to make a dump of the memory to file, for further inspection are the following:
- Select the process to inspect in the Applications pane
- Select the "Monitor" tab of the process to inspect
- Press the "Heap Dump" button
It might make sense to zip the dump file, when As the heapdump can be quite large, consider zipping it before sending it to a 3rd party or attaching it to a support case. (since it can be quite large)
| Note |
|---|
Services cannot be inspected! Before trying inspection, make sure the process is started as user process and not as OS service. |
...
case in the Servoy Support system
Overview
Content Tools
Activity