Page History
When your Servoy is using a lot of memory, it might help Servoy R&D to provide a memory to find the origin of this memory use.
A Java Development Kit comes with a tool called VisualVM which shows all kinds of info about the Java Virtual Machine (JVM) and allows to dump the memory.
| Note |
|---|
VisualVM is not part of the Java Runtime Edition (JRE), you really need the JDK |
When launched (on windows) the GUI looks like:
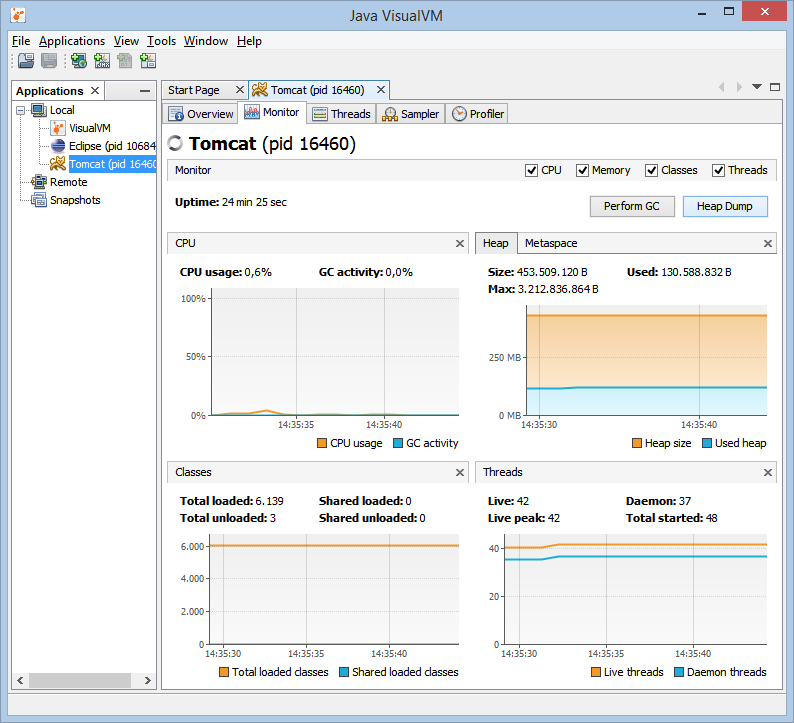
Steps to get a memory dump:
- At the treeview on the left you select the process you want to inspect.
- Select the "Monitor" tab
- Press the "Heap Dump" button
It might make sense to zip the dump file, when attaching it to a support case. (since it can be quite large)
| Note |
|---|
The JVM comes in 32 and 64 bits, when connecting with a 32 bits VisualVM to a 64 bits JVM to inspect, it won't show all the options like "Heap Dump" button. Make sure your VisualVM is of same architecture (32 vs 64 bits) as the inspecting JVM. |
Overview
Content Tools
Activity