When your Servoy is using a lot of memory, it might help Servoy R&D to provide a memory dump to find the origin of this memory use.
A Java Development Kit (JDK) comes with a tool called VisualVM which shows all kinds of info about the Java Virtual Machine (JVM) and allows to dump the memory.
VisualVM is not part of the Java Runtime Edition (JRE), you really need the JDK
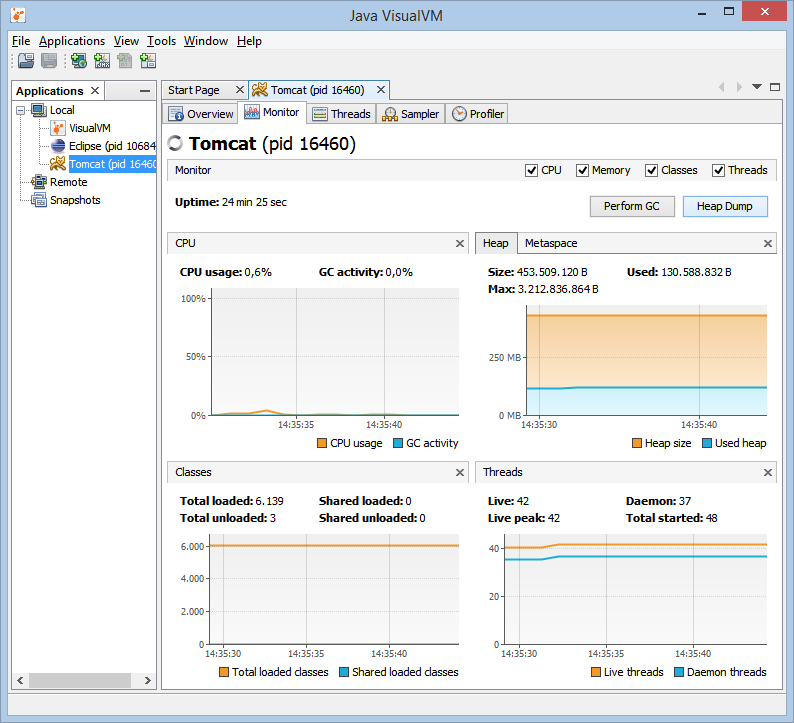
When launched (on windows) the GUI looks like:
Steps to get a memory dump:
- At the treeview on the left you select the process you want to inspect.
- Select the "Monitor" tab
- Press the "Heap Dump" button
It might make sense to zip the dump file, when attaching it to a support case. (since it can be quite large)
The JVM comes in 32 and 64 bits, when connecting with a 32 bits VisualVM to a 64 bits JVM to inspect, it won't show all the options like "Heap Dump" button. Make sure your VisualVM is of same architecture (32 vs 64 bits) as the inspecting JVM.
Overview
Content Tools
Activity